こんにちは、アマチュア無線局のJS2IIUです。
この記事では、StreamlitとPyDeckを使って、アマチュア無線の交信記録を地図上にプロットする方法を紹介します。交信記録はグリッドロケータで記録されていることを想定し、緯度経度に変換してArcで表示します。今回もよろしくお願いします。
st.pydeck_chart()の使い方
st.pydeck_chart()関数のシグネチャとパラメータは以下の通りです。
Python
st.pydeck_chart(pydeck_obj=None, *, use_container_width=False, width=None, height=None, selection_mode="single-object", on_select="ignore", key=None)pydeck_obj: PyDeckのDeckオブジェクトを指定します。use_container_width: チャートの幅をコンテナの幅に合わせるかを指定します。Trueに設定すると、チャートの幅がコンテナの幅に合わせられます。デフォルトはFalseです。width: チャートの幅をピクセルで指定します。use_container_widthがTrueの場合は無視されます。height: チャートの高さをピクセルで指定します。selection_mode: 地図上のオブジェクトの選択モードを指定します。"single-object"(単一選択)、"multi-object"(複数選択)、"none"(選択不可) から選択できます。デフォルトは"single-object"です。on_select: オブジェクトが選択されたときに実行するコールバック関数を指定します。"ignore"(無視)、"callback"(コールバック関数を実行) から選択できます。デフォルトは"ignore"です。key: ウィジェットの識別子となる文字列を指定します。
さらに詳しい内容を知りたい方はこちらの記事を参照して下さい。
交信状況表示プログラムの解説
プログラム全体を示します。その後に個別のプログラム要素について説明していきます。
Python
import streamlit as st
import pydeck


def alpha_to_lonlat(alpha):
    """Converts an alpha character to longitude or latitude."""
    if type(alpha) is not str:
        raise ValueError('Invalid alpha type')

    return (ord(alpha) - 65) * 20 - 180


def alpha_to_sub(alpha):
    """Converts an alpha character to sub square coefficients."""
    if type(alpha) is not str:
        raise ValueError('Invalid alpha type')

    return (ord(alpha) - 65 + 0.5) / 12


def gl_to_latlon(gridlocator):
    """Converts a grid locator to latitude and longitude."""
    if len(gridlocator) < 4 or len(gridlocator) % 2 != 0:
        return None

    gridlocator = gridlocator.upper()

    # South west corner of the FIELD - first two characters
    lon = alpha_to_lonlat(gridlocator[0])
    lat = alpha_to_lonlat(gridlocator[1]) / 2

    if len(gridlocator) < 4:
        lon += 10
        lat += 5
    elif len(gridlocator) < 6:
        # Square - next two characters
        lon += int(gridlocator[2]) * 2 + 1
        lat += int(gridlocator[3]) * 1 + 0.5
    elif len(gridlocator) == 6:
        # subsquare - next two characters
        lon += int(gridlocator[2]) * 2 + alpha_to_sub(gridlocator[4])
        lat += int(gridlocator[3]) * 1 + alpha_to_sub(gridlocator[5]) / 2

    return [lon, lat]


# Define a layer with ArcLayer
#  https://deckgl.readthedocs.io/en/latest/gallery/arc_layer.html

qso_data = [
        {"origin": 'PM85', "destination": 'PM97ej'},
        {"origin": 'PM85', "destination": 'PM64ff'},
        {"origin": 'PM85', "destination": 'PM63ih'},
        {"origin": 'PM85', "destination": 'QM09jj'},
        {"origin": 'PM85', "destination": 'QN00ef'},
        {"origin": 'PM85', "destination": 'PM95wq'},
        {"origin": 'PM85', "destination": 'PM95tw'},
    ]

# apply gl_to_latlon to each dictionary in qso_data then reassign to qso_data
for d in qso_data:
    d['origin'] = gl_to_latlon(d['origin'])
    d['destination'] = gl_to_latlon(d['destination'])
qso_data = [d for d in qso_data if d['origin'] is not None and d['destination'] is not None]


layer = pydeck.Layer(
    "ArcLayer",
    data=qso_data,
    get_source_position="origin",
    get_target_position="destination",
    get_source_color=[255, 255, 140],
    get_target_color=[255, 165, 0],
    auto_highlight=True,
    pickable=True,
    radius=100,
    width_scale=0.00001,
    width_min_pixels=1,
    width_max_pixels=3,
)

# Set the viewport location
view_state = pydeck.ViewState(
    latitude=36,
    longitude=136.0,
    zoom=4.5,
    bearing=0,
    pitch=40,
)

# Render
r = pydeck.Deck(layers=[layer], initial_view_state=view_state)

st.header('QSO data on 2025/01/01')
st.pydeck_chart(r)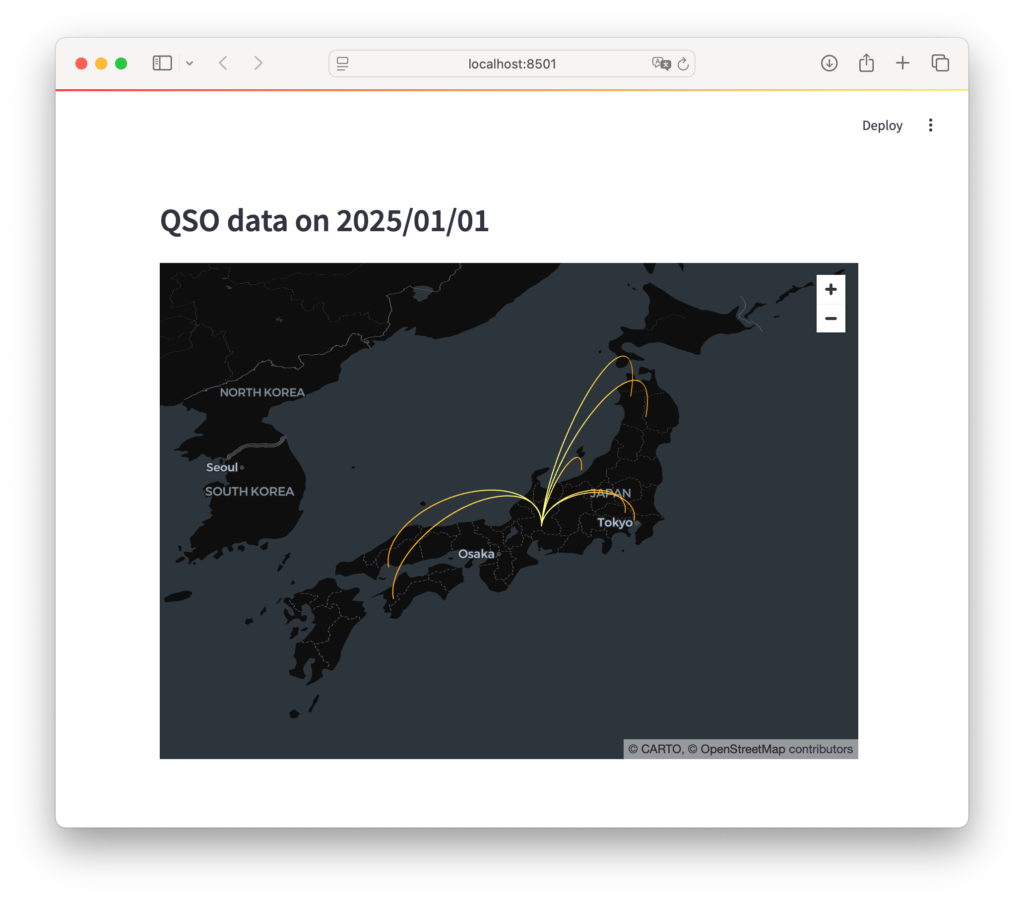
必要なライブラリのインポート
Python
import streamlit as st
import pydeckstreamlit: Streamlitは、PythonでインタラクティブなWebアプリケーションを構築するためのライブラリです。pydeck: PyDeckは、Deck.glをPythonで使えるようにしたライブラリで、地図上に様々なデータを可視化することができます。
グリッドロケータを緯度経度に変換する関数
グリッドロケータがどのような形で定義されているのか、についてはJARLの解説ページを参考にして下さい。
グリッドロケーター
www.jarl.org
Python
def alpha_to_lonlat(alpha):
    """Converts an alpha character to longitude or latitude."""
    if type(alpha) is not str:
        raise ValueError('Invalid alpha type')

    return (ord(alpha) - 65) * 20 - 180


def alpha_to_sub(alpha):
    """Converts an alpha character to sub square coefficients."""
    if type(alpha) is not str:
        raise ValueError('Invalid alpha type')

    return (ord(alpha) - 65 + 0.5) / 12


def gl_to_latlon(gridlocator):
    """Converts a grid locator to latitude and longitude."""
    if len(gridlocator) < 4 or len(gridlocator) % 2 != 0:
        return None

    gridlocator = gridlocator.upper()

    # South west corner of the FIELD - first two characters
    lon = alpha_to_lonlat(gridlocator[0])
    lat = alpha_to_lonlat(gridlocator[1]) / 2

    if len(gridlocator) < 4:
        lon += 10
        lat += 5
    elif len(gridlocator) < 6:
        # Square - next two characters
        lon += int(gridlocator[2]) * 2 + 1
        lat += int(gridlocator[3]) * 1 + 0.5
    elif len(gridlocator) == 6:
        # subsquare - next two characters
        lon += int(gridlocator[2]) * 2 + alpha_to_sub(gridlocator[4])
        lat += int(gridlocator[3]) * 1 + alpha_to_sub(gridlocator[5]) / 2

return [lon, lat]alpha_to_lonlat(alpha): グリッドロケータのアルファベット部分を経度または緯度の計算に使う変数に変換します。alpha_to_sub(alpha): グリッドロケータのサブスクエアのアルファベット部分を経度または緯度の計算に使う変数に変換します。gl_to_latlon(gridlocator): グリッドロケータ全体を緯度経度に変換します。
交信記録データ
データの形式は色々なパターンがあると思います。紙の交信ログから転記する場合もあれば、ADIFから変換する場合もあるかもしれません。ADIFからプログラムを使って変換したい方は、adiftoolsというPython向けのパッケージをご活用ください。
Python
qso_data = [
        {"origin": 'PM85', "destination": 'PM97ej'},
        {"origin": 'PM85', "destination": 'PM64ff'},
        {"origin": 'PM85', "destination": 'PM63ih'},
        {"origin": 'PM85', "destination": 'QM09jj'},
        {"origin": 'PM85', "destination": 'QN00ef'},
        {"origin": 'PM85', "destination": 'PM95wq'},
        {"origin": 'PM85', "destination": 'PM95tw'},
    ]

# apply gl_to_latlon to each dictionary in qso_data then reassign to qso_data
for d in qso_data:
    d['origin'] = gl_to_latlon(d['origin'])
    d['destination'] = gl_to_latlon(d['destination'])
qso_data = [d for d in qso_data if d['origin'] is not None and d['destination'] is not None]qso_data: アマチュア無線の交信記録をリストとして定義します。各要素は辞書で、origin(発信地) とdestination(宛先) をグリッドロケータで指定します。gl_to_latlon関数を使って、グリッドロケータを緯度経度に変換します。
PyDeckのレイヤー設定
Python
layer = pydeck.Layer(
    "ArcLayer",
    data=qso_data,
    get_source_position="origin",
    get_target_position="destination",
    get_source_color=[255, 255, 140],
    get_target_color=[255, 165, 0],
    auto_highlight=True,
    pickable=True,
    radius=100,
    width_scale=0.00001,
    width_min_pixels=1,
    width_max_pixels=3,
)ArcLayerを使って、発信地と宛先を弧で繋いで表示します。get_source_positionとget_target_positionで、弧の始点と終点を指定します。get_source_colorとget_target_colorで、弧の色を指定します。auto_highlightをTrueにすると、マウスオーバーで弧がハイライトされます。pickableをTrueにすると、弧をクリックして選択できます。radius、width_scale、width_min_pixels、width_max_pixelsで、弧の太さなどを調整します。
地図の表示設定
Python
# Set the viewport location
view_state = pydeck.ViewState(
    latitude=36,
    longitude=136.0,
    zoom=4.5,
    bearing=0,
    pitch=40,
)

# Render
r = pydeck.Deck(layers=[layer], initial_view_state=view_state)

st.header('QSO data on 2025/01/01')
st.pydeck_chart(r)ViewStateで、地図の初期表示位置、ズームレベル、回転角度などを設定します。Deckで、レイヤーと表示設定をまとめてrに格納します。st.headerで、Streamlitアプリにヘッダーを表示します。st.pydeck_chart(r)で、PyDeckの地図をStreamlitアプリに表示します。
まとめ
この記事では、StreamlitとPyDeckを使ってアマチュア無線の交信記録を地図上に可視化する方法を紹介しました。グリッドロケータを緯度経度に変換し、ArcLayerを使って交信の様子をわかりやすく表示することができました。
参考になるWEBサイト
Pythonに関する書籍の<PR>です。
24年9月に出版された「ハイパーモダンPython-信頼性の高いワークフローを構築するモダンテクニック」、Claudio Jolowicz著、嶋田、鈴木訳。開発環境の構築、プロジェクトの管理、テストに関して実践的な内容でとても参考になる一冊です。
最後まで読んでいただきありがとうございました。

コメント